 The Let There Be Night science experiment asks, "How much of the night sky has been lost to light pollution?"
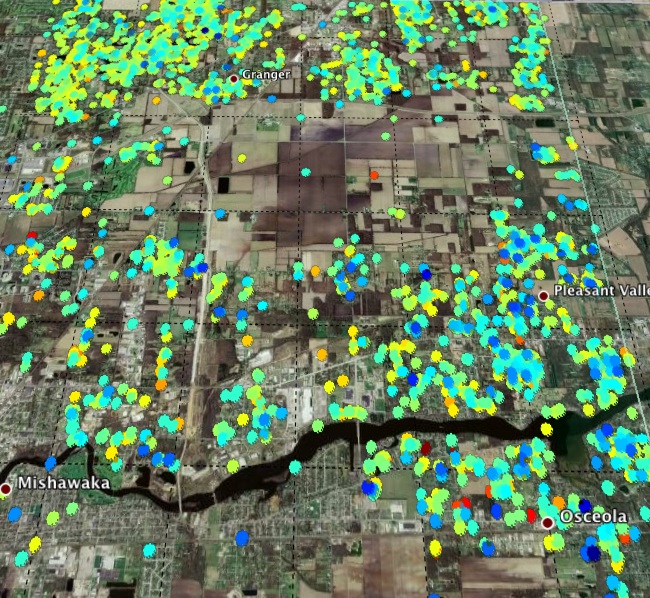
More than 3,400 students from 14 Penn-Harris-Madison (PHM) schools observed Orion from their backyards in the last two weeks of March 2009. They each compared their backyard view to six star charts of Orion with varying levels of light pollution. From that data, a student team made a 3D model of LEGO® blocks that shows visually how much as been lost.
![]()
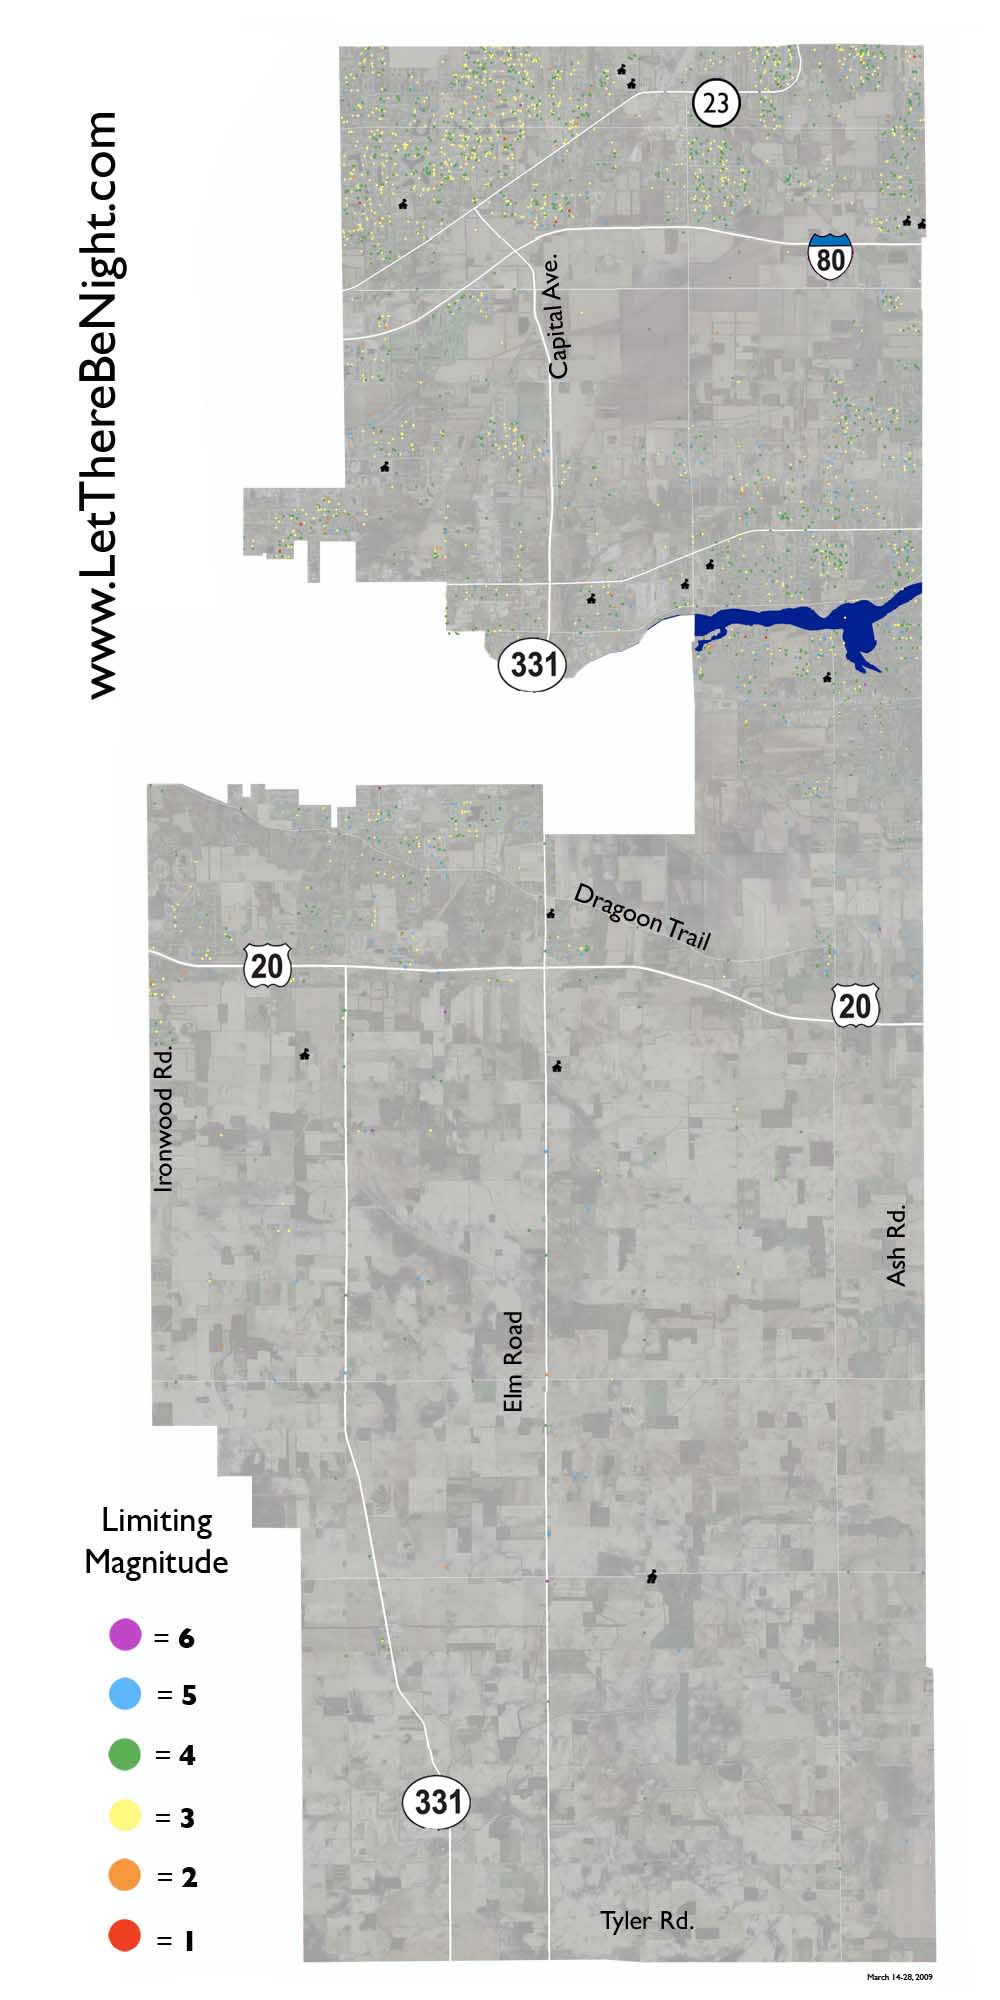
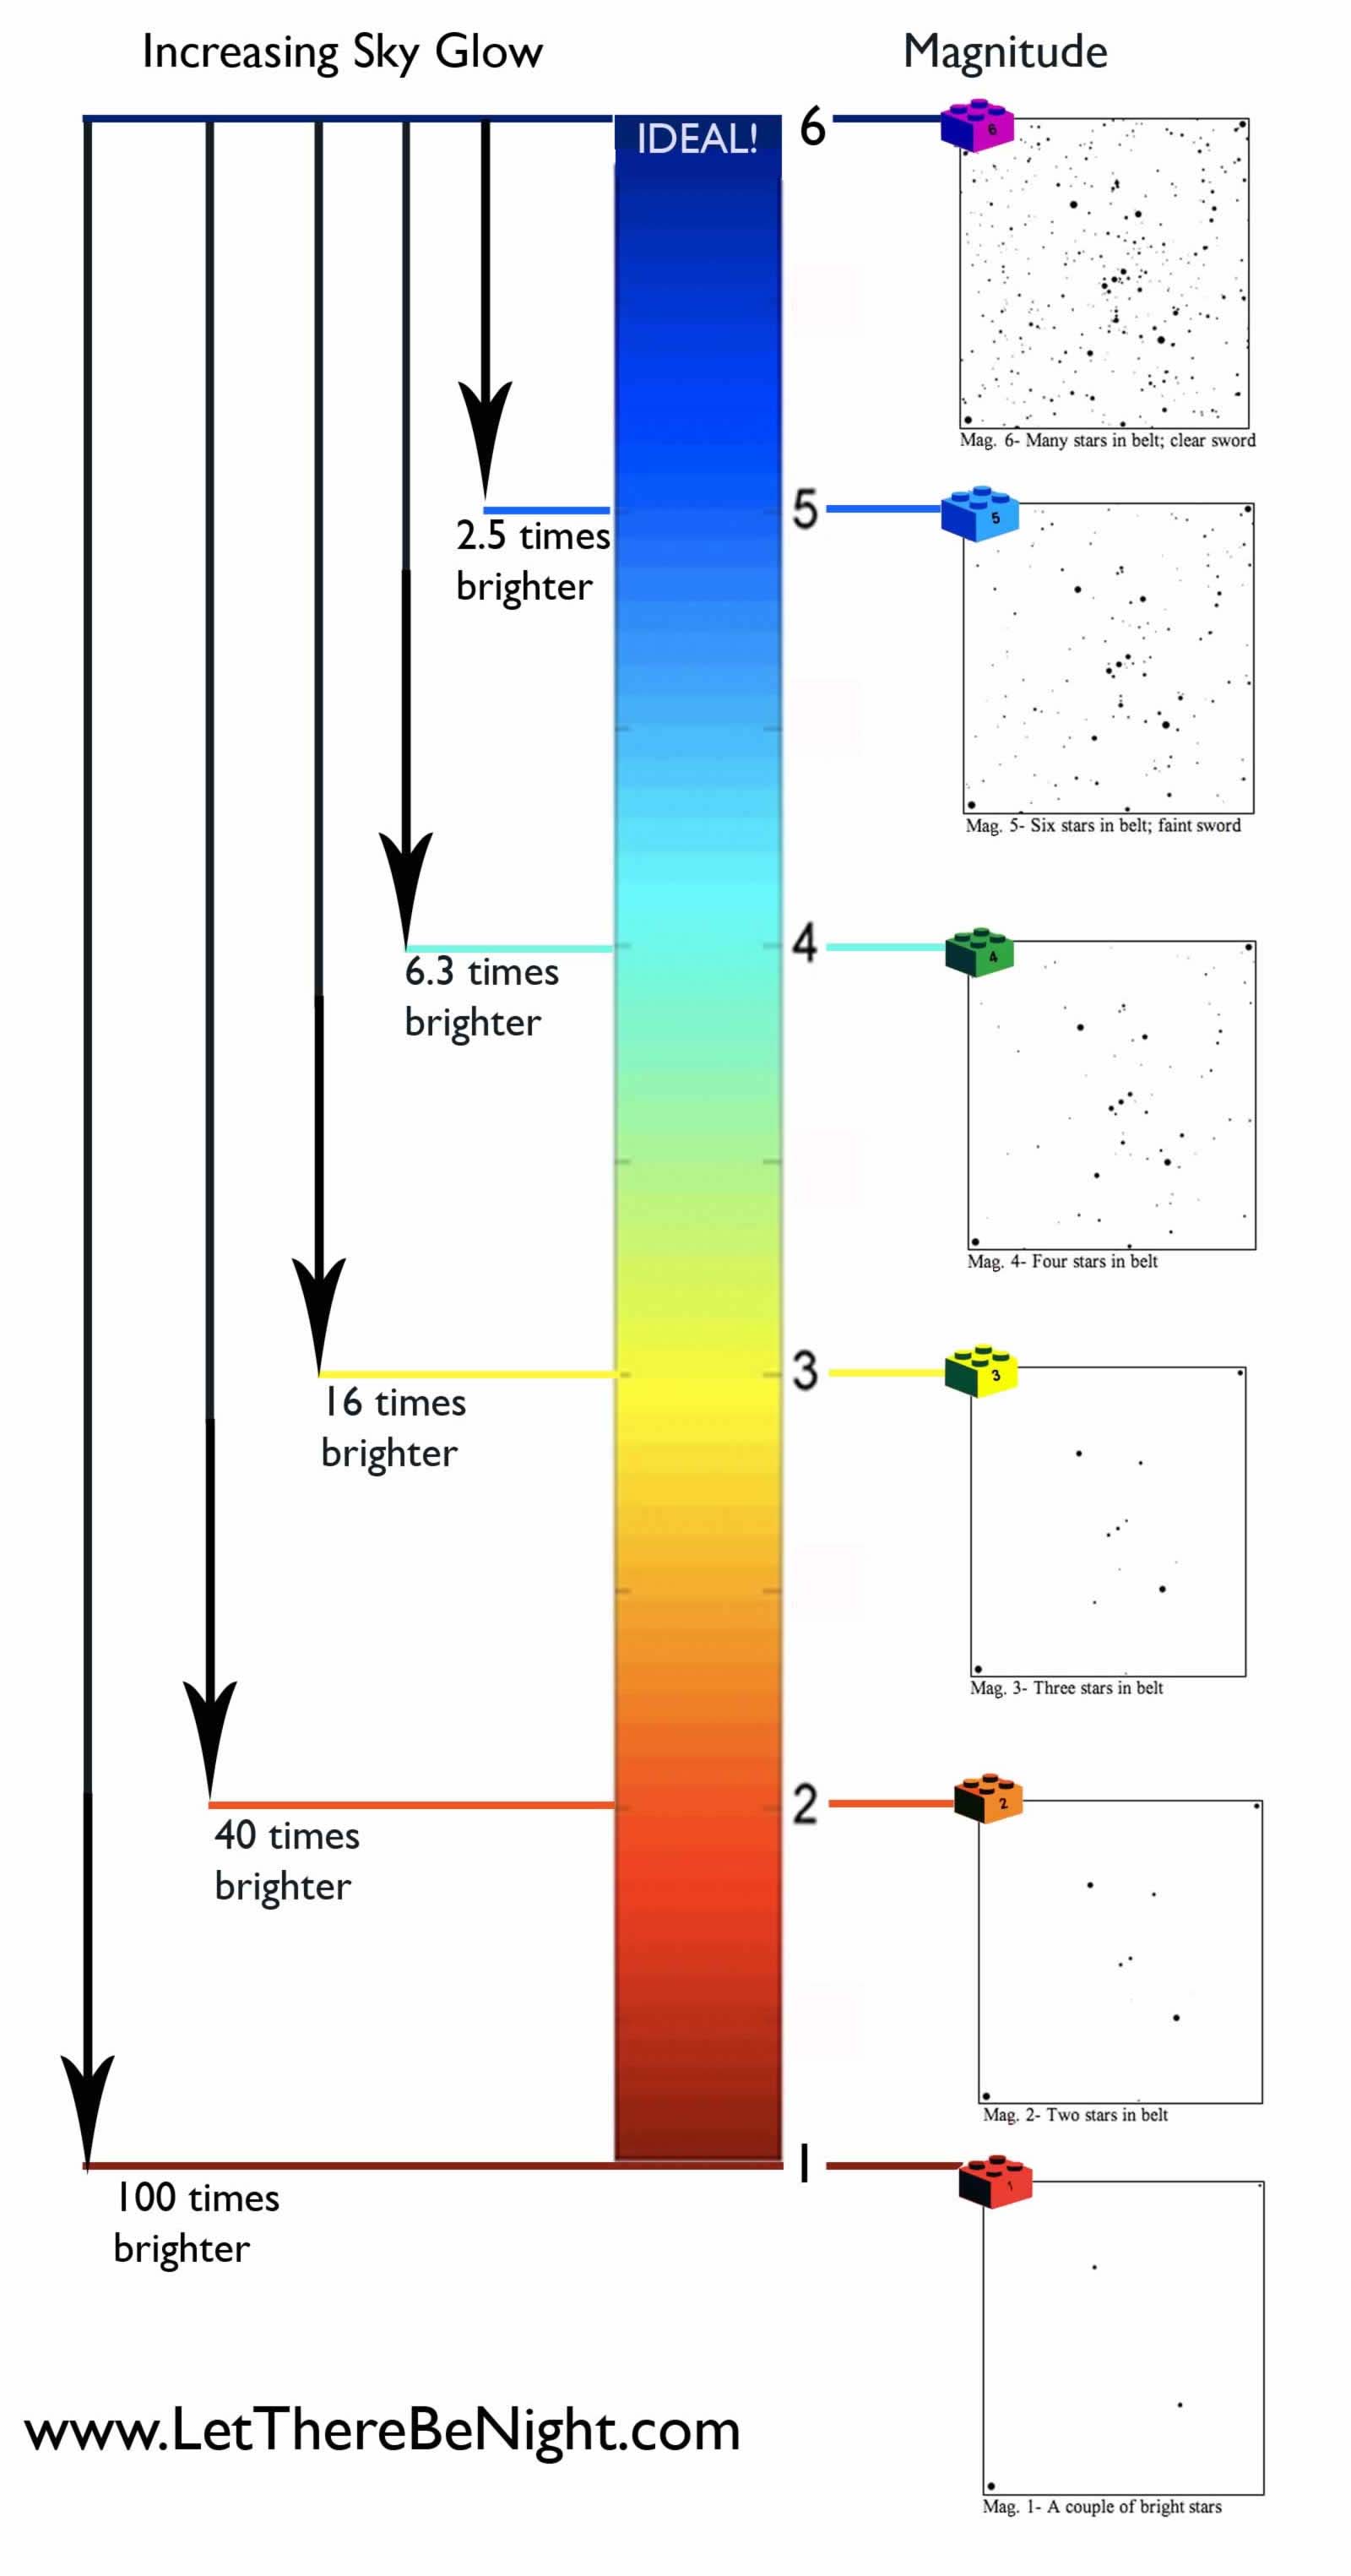
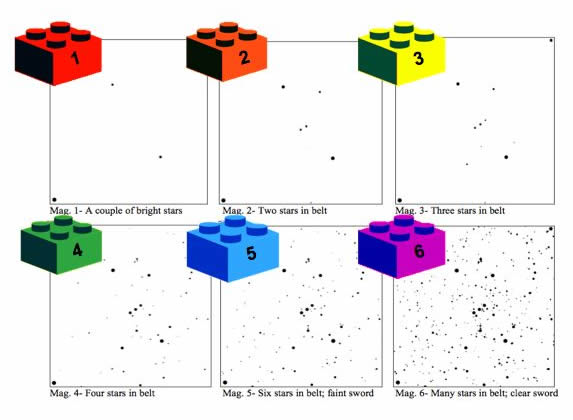 Each chart (and limiting magnitude number) corresponds to a colored LEGO block. For examples, a light polluted sky may have a limiting magnitude of, say, two (mag=2), which is indicated by a stack of two LEGO blocks topped by orange. A dark site, such as mag=5, would be indicated by a stack of five LEGO blocks topped by blue. A dedicated team of students from each school then took the data and placed stacks of scaled LEGOs onto a PHM school district map.
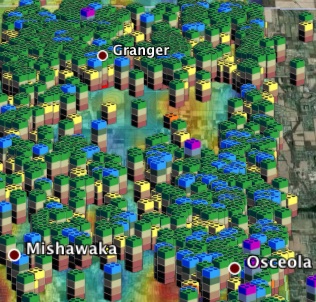
 LEFT: To estimate the loss of night, envision a region with a perfect sky. If mag=6 is the ideal magnitude, then there should be black LEGO blocks across the entire map. (We had intended to use purple LEGO blocks to preserve the ROY G BIV sequence, but the LEGO store didn't have enough purple 2x2 bricks for us at the time.) However, where sky glow has reduced the darkness from ideal level (assuming it's mag=6), the appropriate number of LEGO blocks should be plucked from the stack. That debris is the lost night sky.
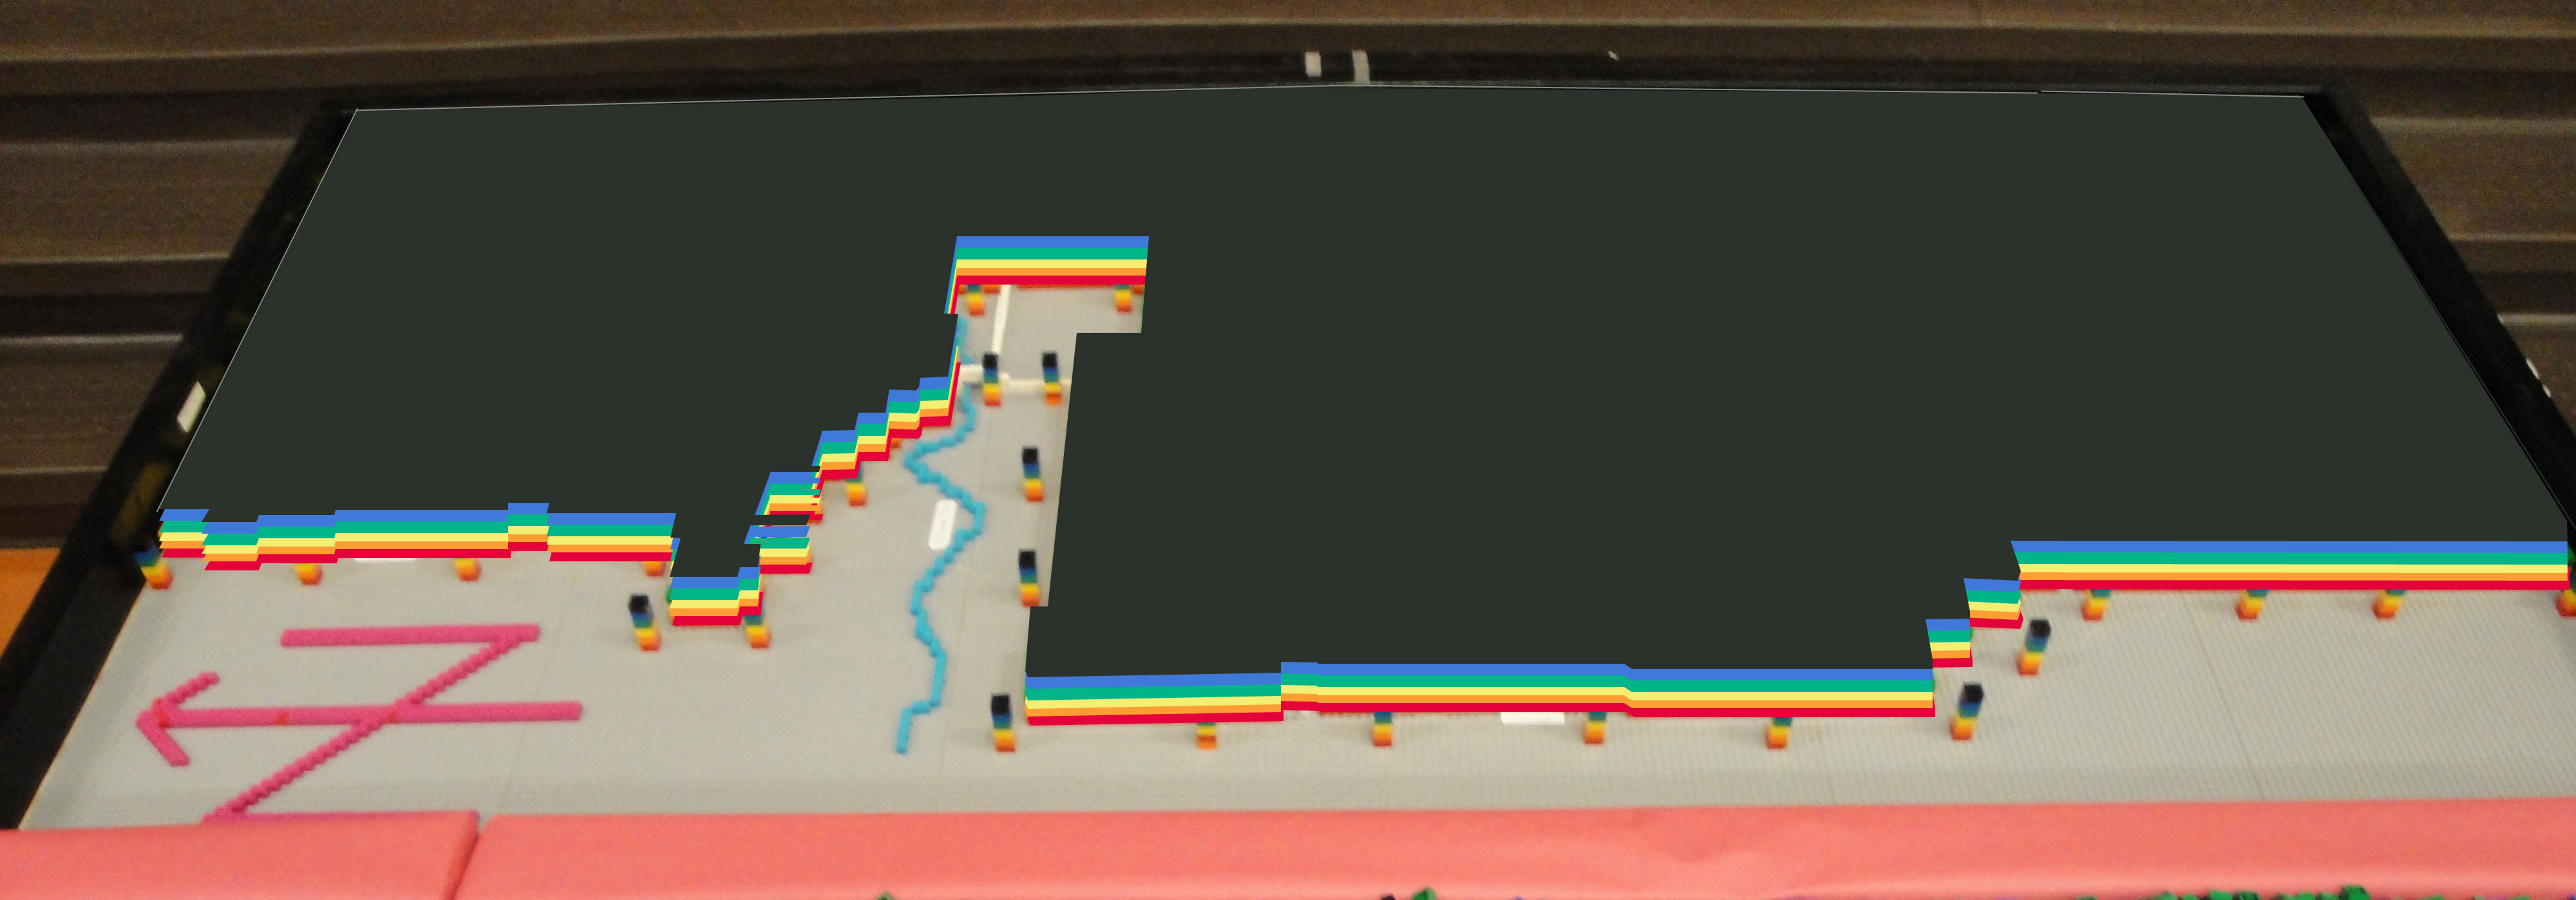
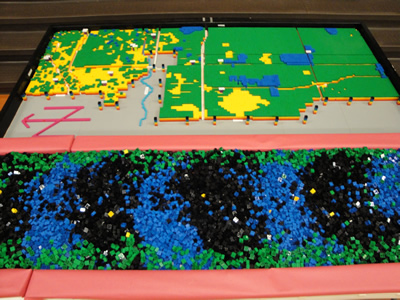 LEFT: The student model depicting the existing sky glow is topped mostly with green (mag=4) and yellow (mag=3) with some blue (mag=5). Nowhere is the sky ideal (mag=6). Meanwhile, the night sky that has been lost to light pollution is the separate pile in the foreground--mostly black (mag=6), blue (mag=5), and green (mag=4) LEGO blocks that were peeled away.
Of the 35,058 LEGO blocks that were stacked to represent an ideal night sky, 12,532 LEGO blocks were removed because they represent night sky lost to light pollution, per 3,400 student observations across the PHM school district.
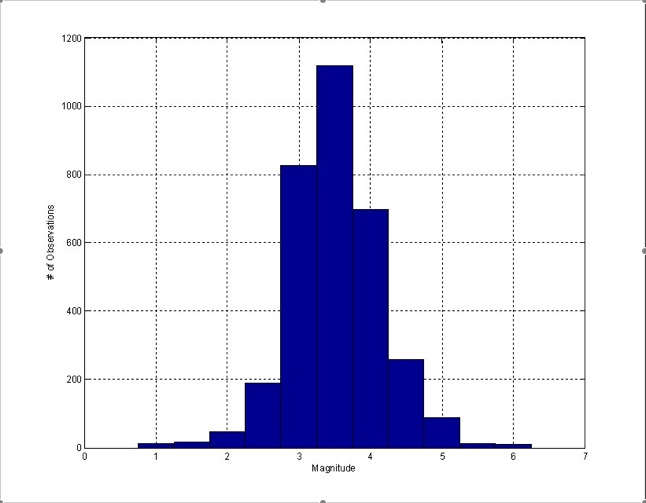
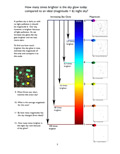
 LEFT: The histogram (courtesy of Michael Warner, NOAO) shows how many people saw each of the magnitude levels. It suggests most of the remaining night sky levels are about mag=3 to mag=4.5. (If the sky had been ideal with all observers seeing mag=6, then the histogram would be one tall column above the number 6.)
RIGHT: To see how many times brighter the sky is now with the observed value compared to the ideal sky with mag=6, enlarge the illustration and interpolate between the arrows of this logarithmic scale.
 From the 3,400 observers, the average Orion sky chart was mag=3.53. To calculate the increase in brightness, take 2.5 to the Xth power, where X is ideal magnitude minus the new magnitude. With an average observed magnitude of 3.53, the sky is brighter by 2.5 to the (6 minus 3.53) power. That is, the night sky is now about nine times brighter than the ideal night sky.
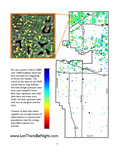
Michael Warner of the National Optical Astronomy Observatory crunched the LTBN data to generate an interactive Google Earth file and several useful diagrams for use by the team. The majority of the 3,400+ student observers contributed their site's limiting magnitude from several clear nights, which were then averaged. The average range betwee high and low values was 1.21. LTBN ran concurrent with Globe at Night, a worldwide star hunt during the 2009 International Year of Astronomy to which we contributed our data.
While both the precision and accuracy of the LTBN results may be disputable (e.g., the data is recorded in whole numbers, the observers are not intensively trained, there are large gaps in data across rural areas, etc.) the results show that the overall trend in local light pollution is indisputable--man made lights are impinging on the natural darkness level of the night sky.
WNDU TV news and the South Bend Tribune reported about the unveiling of the LEGO model and the significant student effort.
By The Numbers: From more than 35,000 stacked LEGO blocks that would represent an ideal night sky across the PHM school district, over 12,000 LEGO blocks were removed because they represent magnitudes of dark sky lost to light pollution. The histogram suggests most of the remaining night sky levels are about mag=3 to mag=4.5. The increase in brightness from an ideal sky (assuming mag=6) to the current sky (3.53) is about 9 times from the observed sites.
Interpretations
Each school received a four-page "Let There Be Night Analysis" for all teachers and students in grades 3-8.
Page 1 opens with general questions about outdoor lighting issues.
Page 2 shows the data that was gathered district-wide.
Page 3 illustrates how many times brighter the local night sky is than an ideal sky for each loss of magnitude. This diagram in particular illustrates how much of the night sky has been lost.
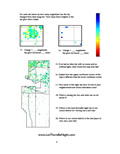
Page 4 compares and asks about the difference in data density and sky glow levels as seen across the distrct.
In the Schools: To see what students did in their schools in preparation for Let There Be Night, select the individual school on the interactive PHM map.
Let There Be Night and the Scientific Method
LTBN features the key steps of the scientific method, as detailed below.
- Define the question/problem.
By how much have we degraded the night sky from its natural state? How can PHM and the community lessen its impact on the night? - Gather information (observe) and resources.
Planetarium visit; www.LetThereBeNight.com; Let There Be Night DVD; recommended books; Orion star charts; Sky Quality Meters. - Form hypothesis.
Local outdoor lights have quantifiably brightened the sky throughout the boundaries of PHM. PHM and the community can take several identifiable steps to improve its outdoor lighting. - Perform experiment and collect data.
All students observe Orion and contribute their data to the 2009 Globe at Night star count while small teams quantify sky glow from each PHM school with hand-held meters. - Analyze data.
During the last two weeks of March 2009, students will share their findings in class and on a school boundaries map. Online or other digital resources will map the district-wide results, which will be shared and compared with the global community. - Interpret data and draw conclusions.
Teachers will guide discussions about the experience; about emerging trends from the data; and about how we prioritize the tradeoffs of outdoor lighting technology. The combined school teams will meet to make recommendations on how PHM can save money and energy while lessening its footprint on the night sky. - Publish results.
May 11th PHM School Board meeting; national publications; websites.